Field Notes: The Day I Asked for His Labor Burden Rate
May 1, 2026
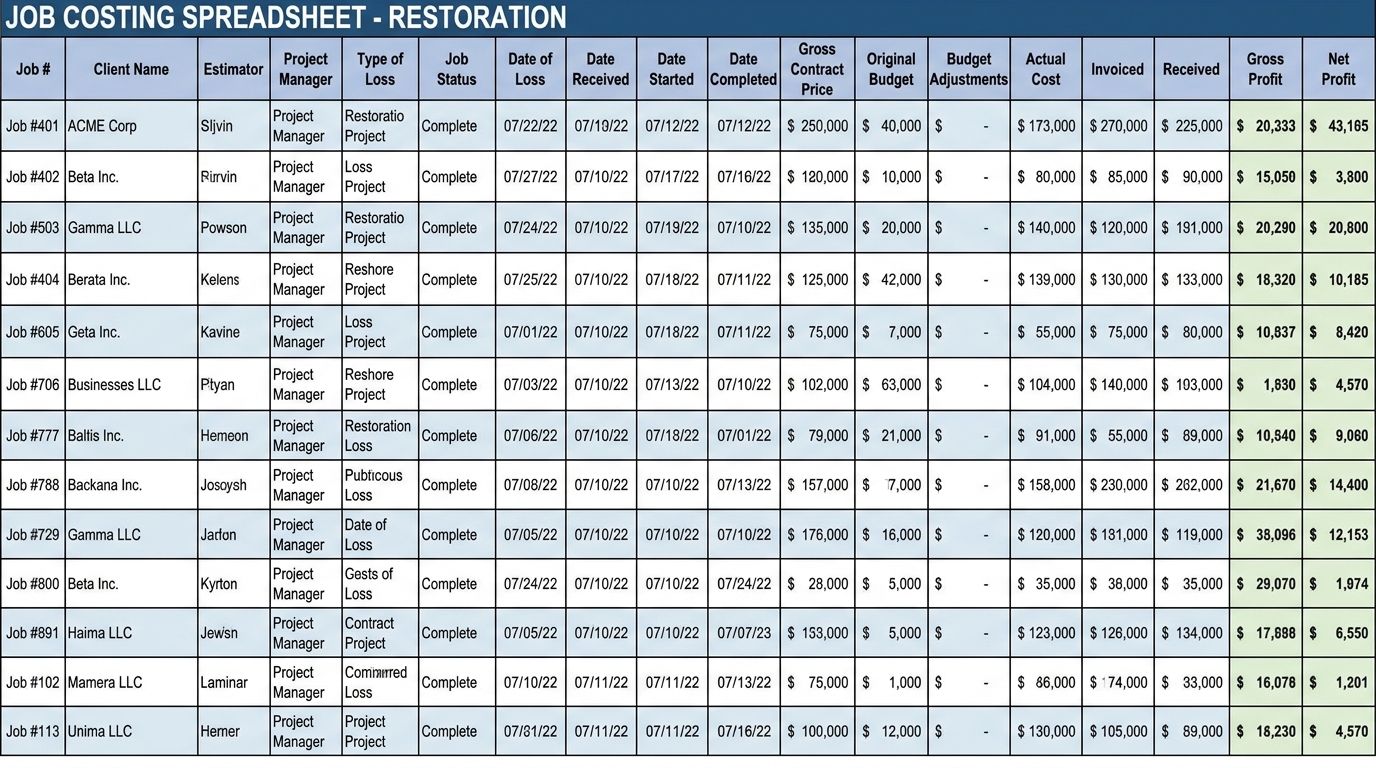
From my diagnostic notebook. Details changed to protect the client; the numbers are real.
He built the restoration company out of his carpet cleaning business — a path I know well, because it’s mine. The difference: when I added restoration, I built a new pricing model from scratch. He adapted the one he had. Seven years later he was running $2.8M of restoration work on pricing habits formed cleaning carpets. “My margins seem low,” he said. “But I’ve always been price-competitive, and it’s worked.”
So I asked for his fully-loaded labor burden rate. The long pause told me everything.
Notebook Entry 1 — Labor, Understated by $11 an Hour
He was costing labor at base wage. His true burden — FICA, SUTA/FUTA, workers’ comp at a 10.2% rate in his state, health benefits, PTO — put his two field grades at $34.10 and $26.80 an hour against his working inputs of $24 and $19. On a standard mitigation job with 40 field hours, that’s $440 of labor cost that existed in reality and nowhere in his estimates. At 22 jobs a month: $9,680 a month absorbed as margin erosion.
Notebook Entry 2 — The Rate Card from 2019
His dehumidifier daily rate: $78 a unit, set in 2019, never revisited. The Xactimate regional rate for the same equipment in his market: $96 a day. At 150 unit-days a month, $2,700 a month of equipment revenue simply never asked for.
Notebook Entry 3 — Work Done, Documented, Never Billed
Daily monitoring visits were performed and documented on every job. His estimates included them on 60% of jobs. The other 40% happened — trucks rolled, techs checked, notes were written — and were never billed. 40% of 22 jobs × $65 × an average of 6 visits = $3,432 a month of performed, documented, unbilled service.
The Total in the Margin
Three gaps. $15,812 a month. $189,744 a year — 6.8 percentage points of net margin on $2.8M of revenue, sitting invisibly in the pricing structure for years. None of it required raising a single price to a single customer. The fixes were a recalculated burden built into the estimating model, equipment rates updated to current regional figures with a quarterly review, and one line added to the invoice checklist: verify all documented monitoring visits are billed. Ninety days later his real gross margin had moved from 39% to 46%.
There’s a reason this pattern repeats: pricing drifts and costs don’t. Rates you set in a cheaper year keep billing in an expensive one. The complete case file is The Profit Detective Files: The Water Damage Company That Priced Like a Carpet Cleaner.
Related reading
- The Water Damage Company That Priced Like a Carpet Cleaner
- Pricing by Job Type in Restoration
- What I Found in a $2.3M Alberta Restoration Company With No Cash
Mike McCabe is The Profit Detective — a 36-year restoration industry veteran who has conducted pricing audits for water damage restoration companies across North America.